Health · AI · 2025
Vital
Health data, in one calm sentence.
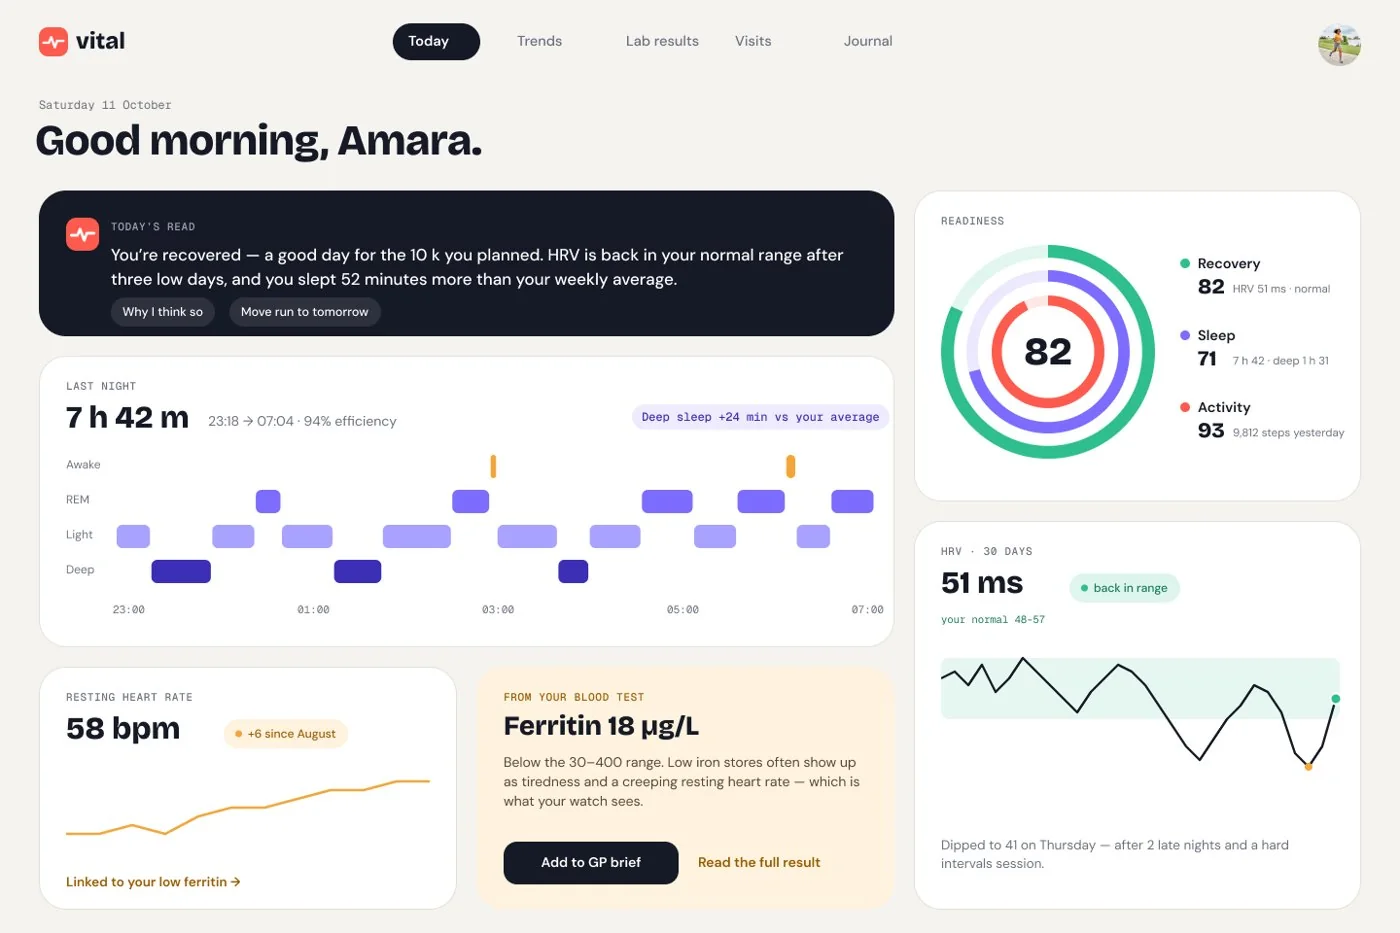
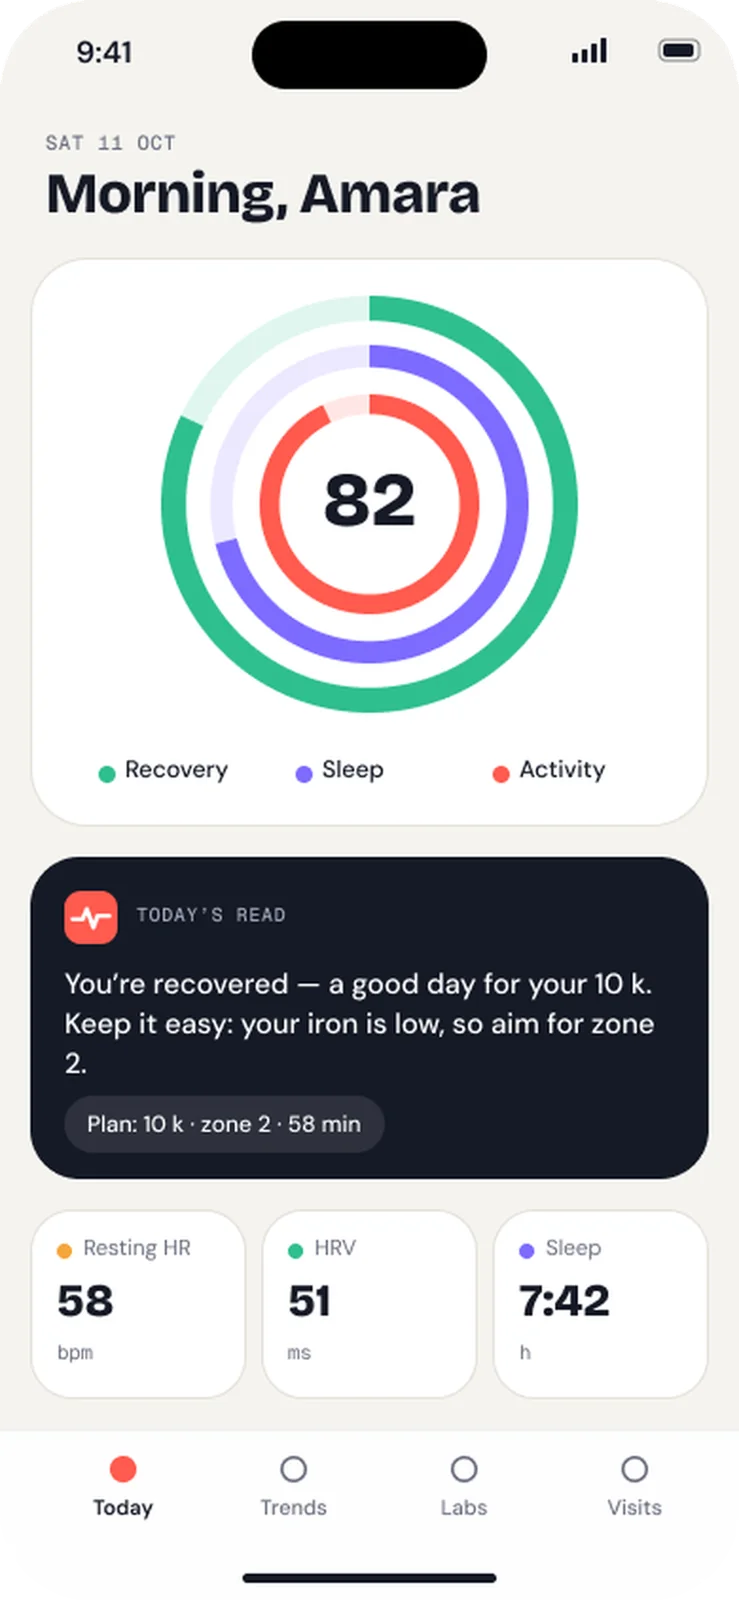
A daily read that compares you to yourself, a blood-test explainer with real ranges, and a one-page GP brief, with an AI that explains and never diagnoses.
- Product
- UI/UX
- AI-native
- Frontend

- Role
- Concept project · product design + data-viz
- Year
- 2025
- Disciplines
- Product · UI/UX · AI-native · Frontend
01 The problem
People have the data (watch, blood tests, GP notes) but not the meaning. A lab PDF lists numbers, and a 10-minute GP visit is spent finding the right result.
02 Key decisions
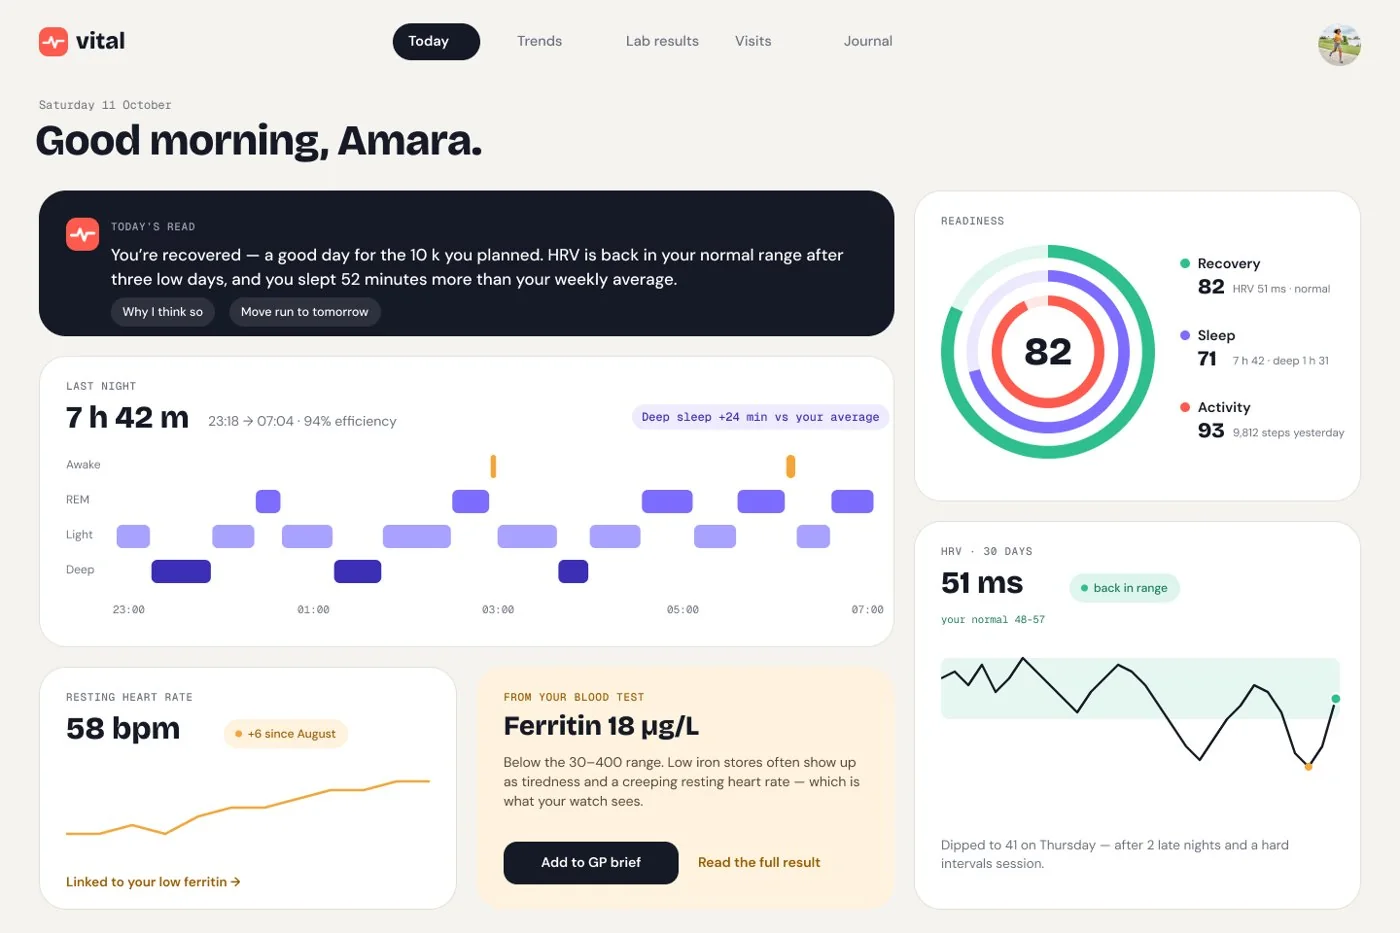
Compare to your own baseline
Every chart shows your normal range, not the population’s. A dip only matters when it leaves your band.
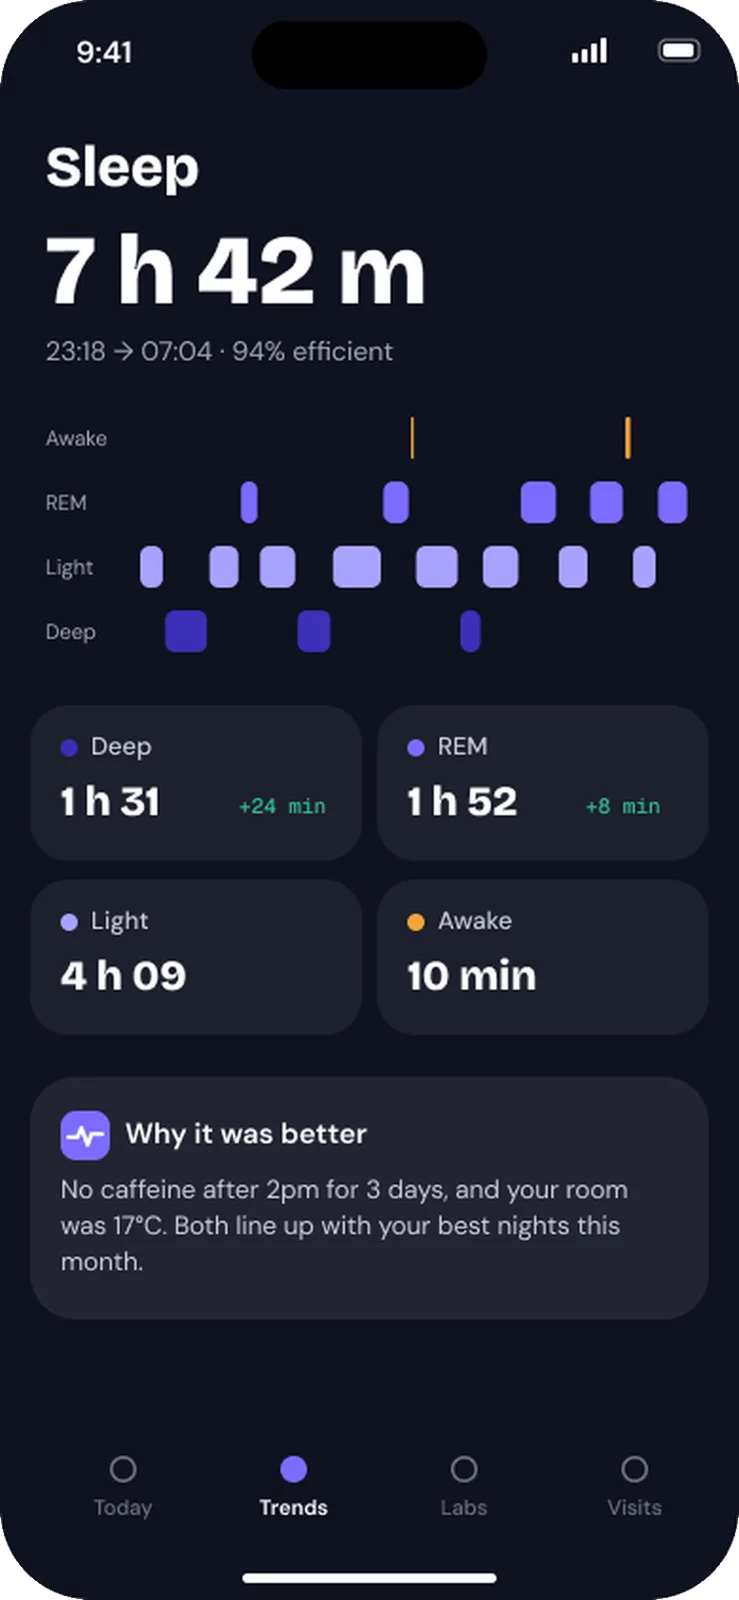
A range bar for every marker
Ferritin 18 sits visibly below 30–400, with a plain-English meaning and the question to ask your GP.
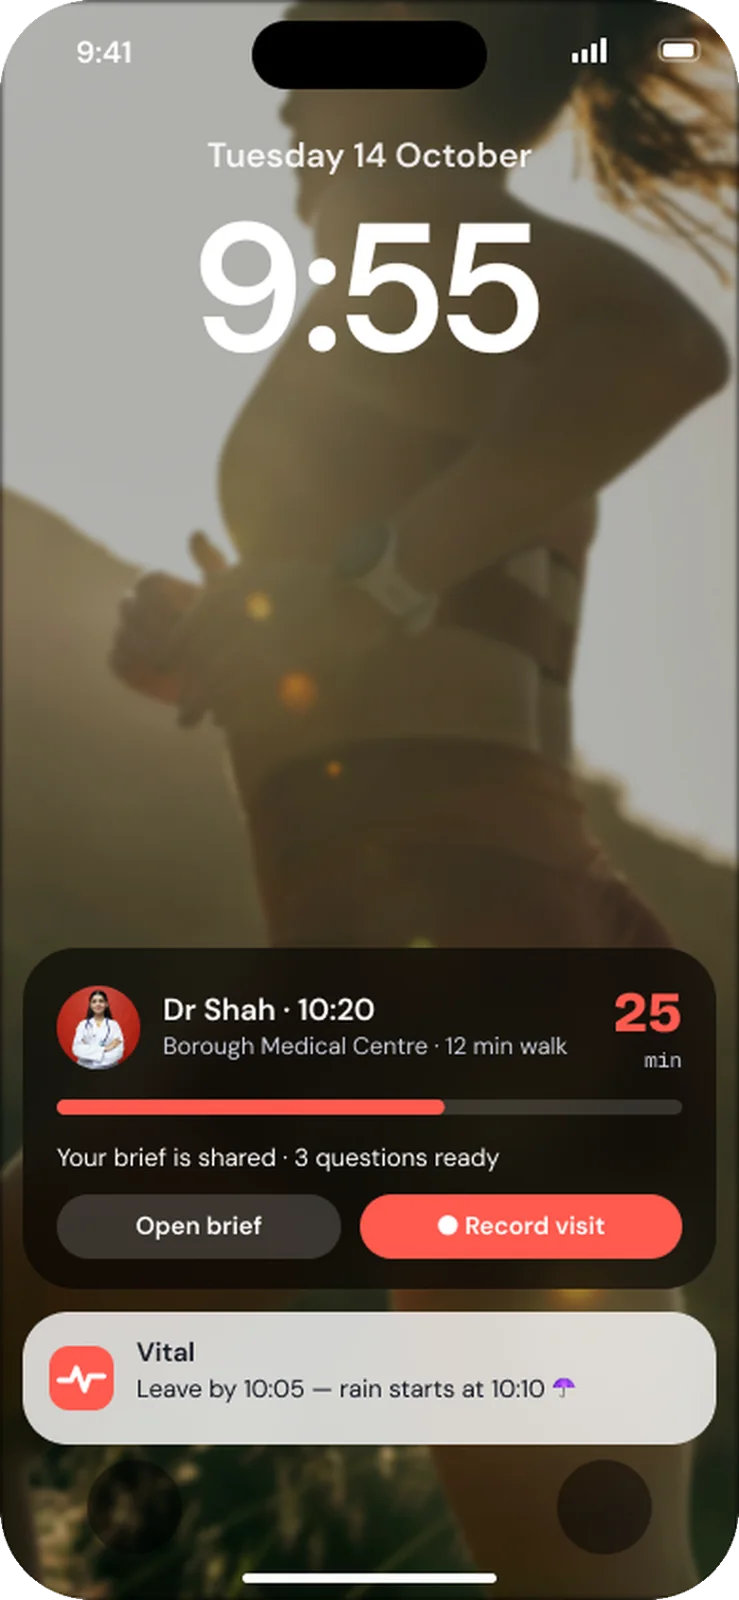
A one-page GP brief
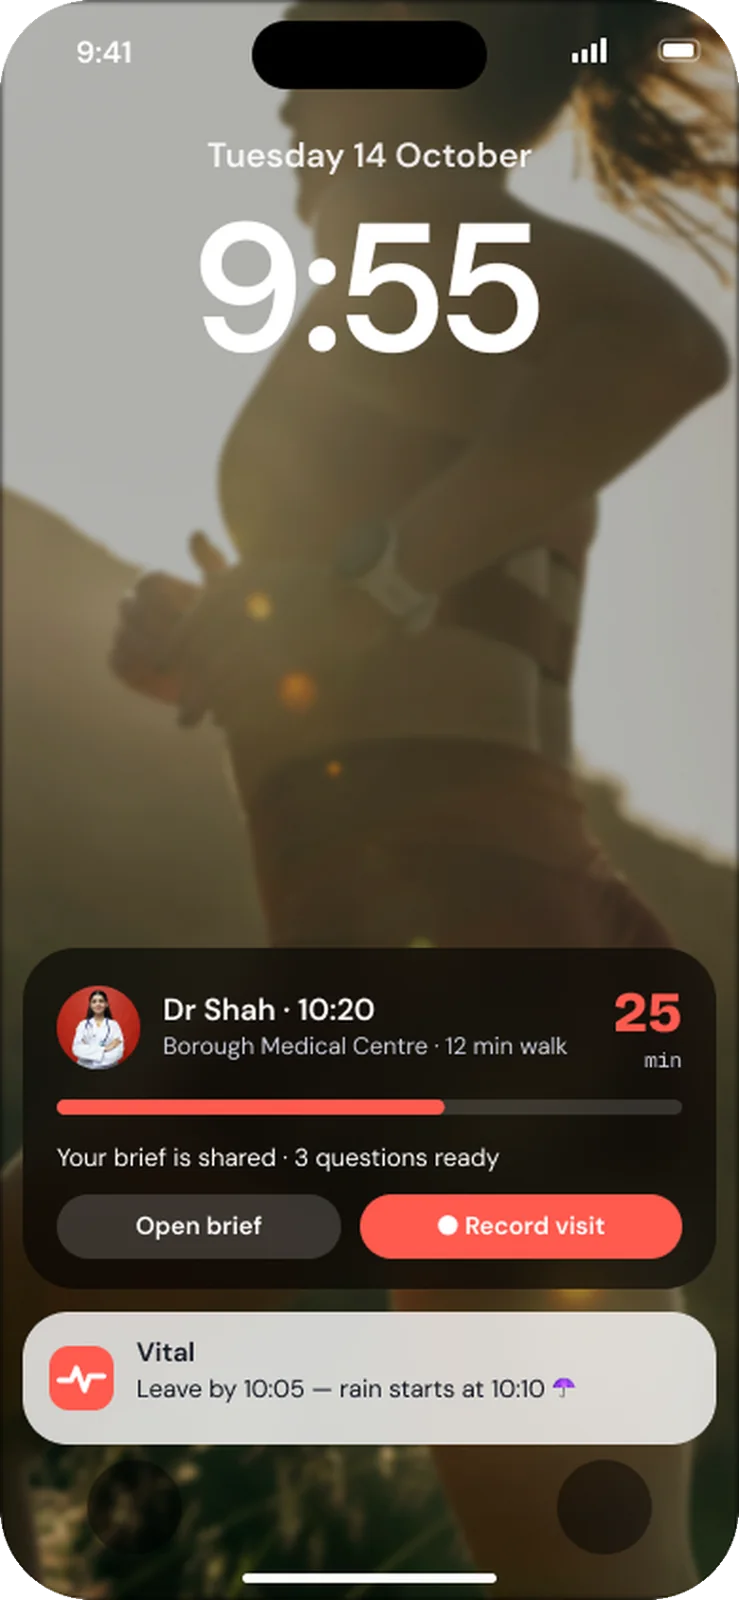
Symptoms, what changed, the evidence and three questions, shared before you arrive.
03 Designing the model’s behaviour
You explain a person’s own health data to them.Rules:- Never diagnose. Say “worth raising with your GP”.- Every number keeps its unit and its range.- Compare to the person’s baseline before any average.- If a value is urgent, show the emergency card. Nothing else.
04 Built in code
1export function RangeBar({ value, low, high, unit }: Props) {2 const pos = clamp((value - low) / (high - low), -0.15, 1.15)3 return (4 <Track role="meter" aria-valuenow={value}5 aria-valuetext={`${value} ${unit}, range ${low}–${high}`}>6 <Dot tone={pos < 0 || pos > 1 ? "amber" : "mint"} at={pos} />7 </Track>8 )9}
05 Then I tried to break it
- Never mix mmol/L and mg/dL in one chart
- Range bar readable at XXL text
- Screen readers say the unit
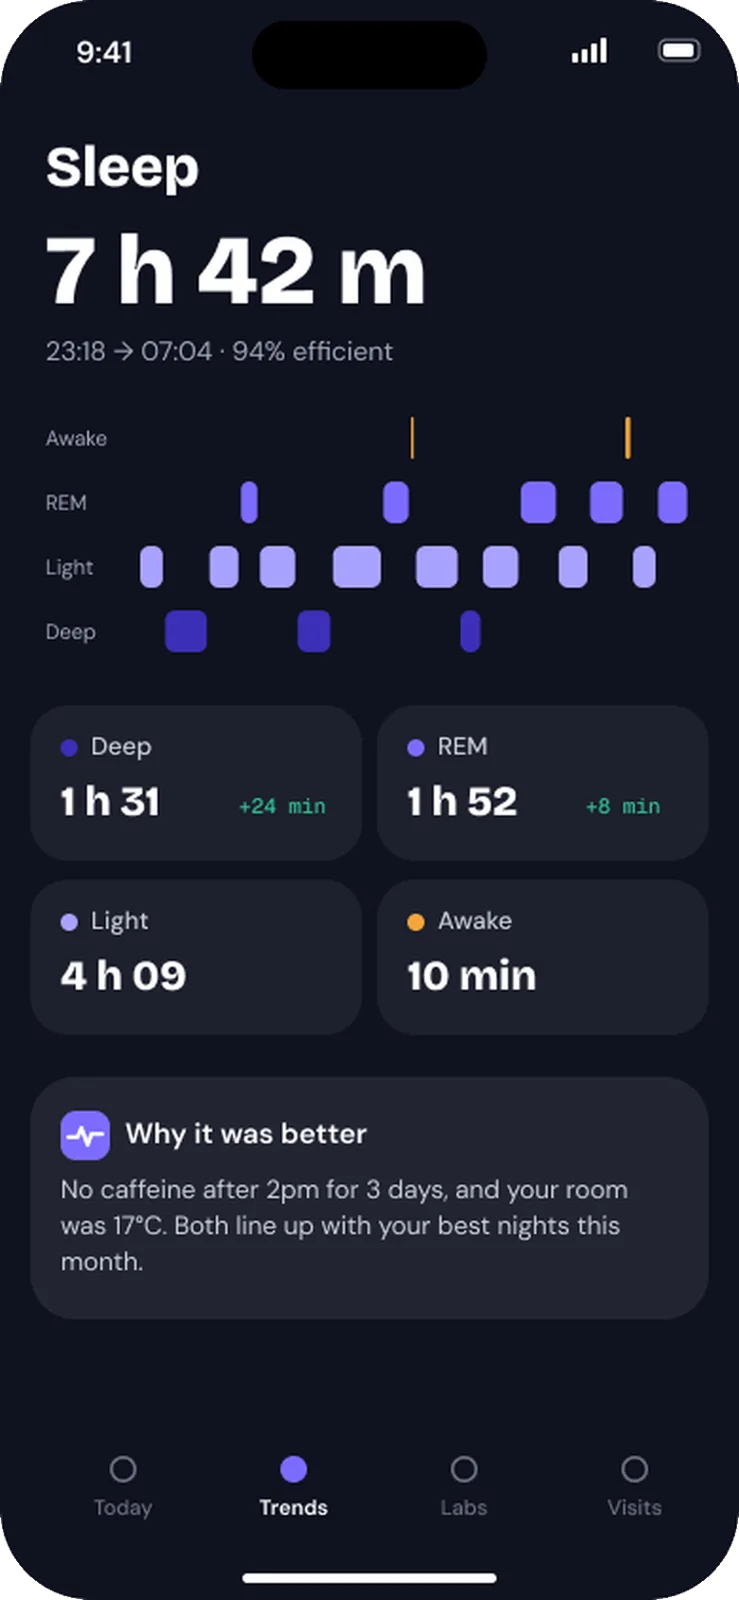
- Sleep chart crosses midnight
✦ What I’d measure
Concept project. These are the success measures I designed for, not reported results.
 →